ZNAPZ Blog
Tivoli, Maximo, Java, Open Source, Web, MEA, MIF, BIRT, SQL
Wednesday, March 14, 2012
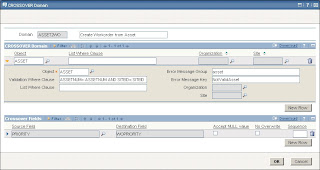
Crossover Domains explained
An easy example is the Asset field on a work order. When you select an asset, Maximo also copies the priority from the asset to the Priority field on the work order. This happens because there is a crossover domain for this. Take a look at it: in the application Domains, search for ASSET2WO.
Monday, January 02, 2012
Modifying size of text boxes
Thursday, November 10, 2011
Server names for cluster members
This article will show you how to give each cluster member a unique name.
Friday, October 28, 2011
How labels work in Maximo 7
Tuesday, September 07, 2010
Oracle escaping special characters
In a nutshel
Turn of special meaning of chars
-- The ampersand has no special meaning anymore SET DEFINE OFF; SELECT 'V&D' FROM dual;
Escaping characters in LIKE
-- The meaning of the underscore is escaped SET ESCAPE ON; SELECT * FROM maxtable WHERE tablename LIKE 'A\\_%' ESCAPE '\\';
Friday, February 22, 2008
Quartz - Run Now
Quartz is an open source job scheduling system written in Java. Executing a job in quartz is based on the definition of triggers. But what if you are in a development environment where you don't want to schedule jobs and want to be able to run them on demand? The API of version 1.6.0 tells us that the triggerJob method in the Scheduler class can be used for that. Great! But the triggerJob method also seems to throw away your job from the scheduler. So the second time you run the job it's bingo!
A possible workaround we figured out for this is to reschedule the job with a simple trigger which will run immediatly:
scheduler.deleteJob(jobName, groupName);
scheduler.scheduleJob(
jobDetail,
new SimpleTrigger(jobName, groupName)
);
You could of course also use the rescheduleJob method but then you have to be sure the job is already scheduled. In our situation this was not the case.
Thursday, February 14, 2008
Sparklines with the Google Chart API
Sparklines are described in Edward Tufte's book Beautiful Evidence (2006) as “small, high resolution graphics embedded in a context of words, numbers, images”. In one of our projects we needed sparklines and one option was to use this open source package by Larry Ogrodnek. Just out of curiousity I was wondering how far we would come if we would use the Google Chart API. My final result looked promising ...
... but there was no way I could get rid of the gray x- and y-axis.
That was until I ran into this article where I saw sparklines created with the Google Charts API and without the x- and y-axis. How the hell did he do it?
Well ... it seems to be an undocumented feature also used by Google on their financial site. Instead of using cht=lc (chartype is line chart) you can use cht=lfi (charttype is financial line chart). And yes here is the final result:
Grab the code:
http://chart.apis.google.com/chart?chs=80x20&cht=lfi&chco=0077CC&&chm=B,E6F2FA,0,0,0&chls=1,0,0&chd=t:27,25,25,25,25,27,100,31,25,36,25,25,39,25,31,25,25,25,26,26,25,25,28,25,25,100,28,27,31,25,27,27,29,25,27,26,26,25,26,26,35,33,34,25,26,25,36,25,26,37,33,33,37,37,39,25,25,25,25